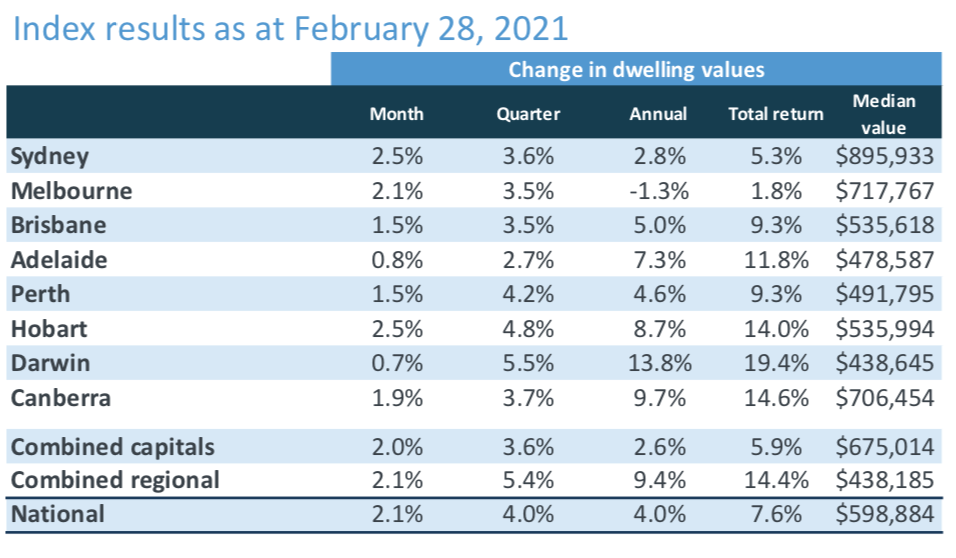
Australian home values surged 2.1% higher in February; the largest month-on-month change in CoreLogic’s national home value index since August 2003.
Australian home values surged 2.1% higher in February; the largest month-on-month change in CoreLogic’s national home value index since August 2003. Spurred on by a combination of record low mortgage rates, improving economic conditions, government incentives and low advertised supply levels, Australia’s housing market is in the midst of a broad-based boom.

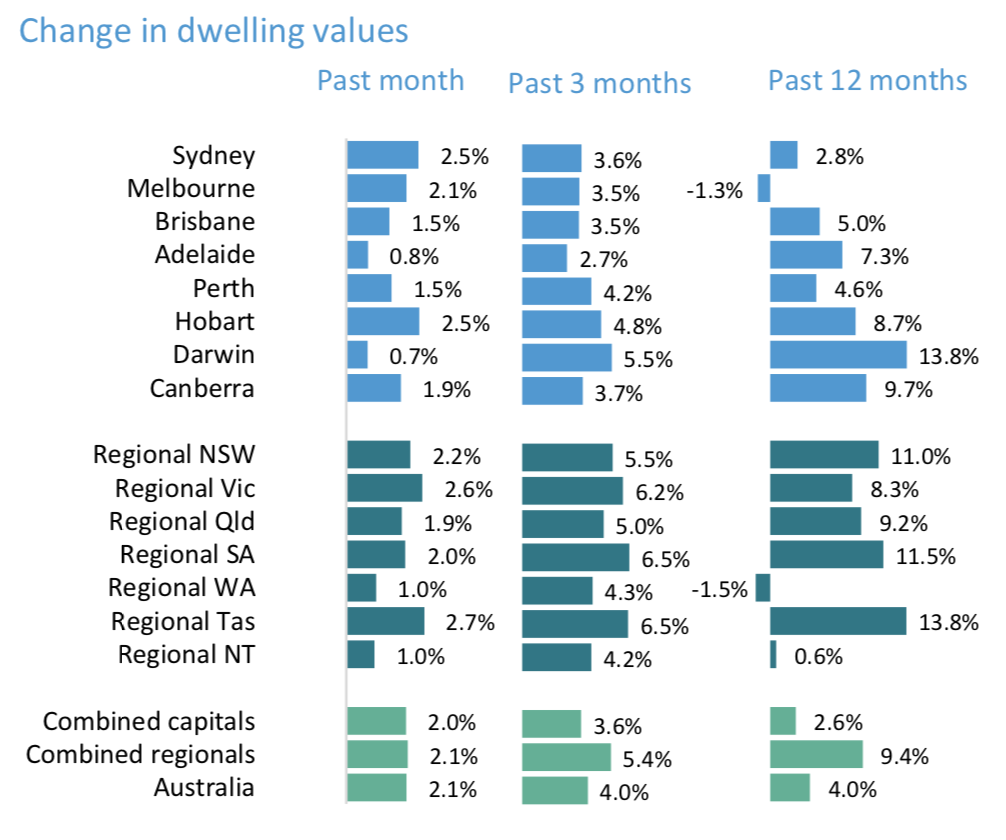
Housing values are rising across each of the capital city and rest of state regions, demonstrating the diverse nature of this housing upswing.
According to CoreLogic’s research director, Tim Lawless, a synchronised growth phase like this hasn’t been seen in Australia for more than a decade. “The last time we saw a sustained period where every capital city and rest of state region was rising in value was mid-2009 through to early 2010, as post-GFC stimulus fueled buyer demand.”

Sydney and Melbourne were among the strongest performing markets, recording a 2.5% and 2.1% lift in home values over the month respectively, as Australia’s two largest cities caught up from weaker performance through 2020. The quarterly trend however, is still favouring the smaller cities; Darwin housing values rose 5.5% over the past three months, Hobart values rose 4.8% and Perth was up 4.2%.
“Whether this new found growth in Sydney and Melbourne can be sustained is unclear. Both cities are still recording values below their earlier peaks, however at this current rate of appreciation it won’t be long before Australia’s two most expensive capital city markets are moving through new record highs. With household incomes expected to remain subdued and stimulus winding down, it is likely affordability will once again become a challenge in these cities,” Mr Lawless said.

Regional markets (up +2.1% over the month) have continued to show a higher rate of capital gain relative to the capital cities (up +2.0%), however the performance gap has narrowed compared with the earlier phase of the growth cycle. Regional areas generally recorded less of a decline in housing values through the worst of the COVID period last year, while also showing an earlier and stronger growth trend through the second half of last year. This regional preference is reflected in the annual growth trend, where the combined regionals index is 9.4% higher while the combined capital city index is up a much smaller 2.6%.

A housing market trend that has persisted through the COVID period to-date is the weaker performance of unit markets relative to detached housing. Across CoreLogic’s combined capitals index, house values (+4.4% over the past three months) have recorded a growth rate more than three times higher than that of its unit counterparts (+1.4%). There are some tentative signs this trend could become less obvious, with Sydney unit values recording their first month of growth since April last year and Melbourne unit values recording their largest gain since late 2019.
Share This Article
Previous Articles
- November 2024 1
- October 2024 1
- August 2024 1
- July 2024 1
- June 2024 1
- May 2024 3
- April 2024 2
- March 2024 1
- February 2024 1
- November 2023 1
- October 2023 1
- September 2023 1
- August 2023 1
- July 2023 1
- June 2023 1
- May 2023 2
- April 2023 1
- March 2023 1
- February 2023 1
- January 2023 1
- December 2022 1
- November 2022 3
- October 2022 1
- September 2022 2
- August 2022 1
- July 2022 4
- June 2022 3
- May 2022 2
- April 2022 1
- March 2022 1
- February 2022 1
- January 2022 1
- October 2021 1
- September 2021 4
- August 2021 1
- July 2021 2
- May 2021 1
- April 2021 2
- March 2021 2
- February 2021 1
- January 2021 2
- December 2020 2
- November 2020 2
- October 2020 2
- August 2020 1
- May 2020 2
- April 2020 2
- November 2019 1
- October 2019 1
- August 2019 1
- July 2019 1
- June 2019 1
- May 2019 1
- February 2019 1
- January 2019 1
- October 2018 1
- September 2018 1
- July 2018 2
- June 2018 2
- May 2018 1
- April 2018 2
- March 2018 3
- January 2018 1
- December 2017 3
- November 2017 1
- October 2017 1
- August 2017 1
- July 2017 1
- June 2017 5
- May 2017 31
- April 2017 30
- March 2017 32
- February 2017 28
- January 2017 31
- December 2016 31
- November 2016 29
- October 2016 30
- September 2016 30
- August 2016 26
